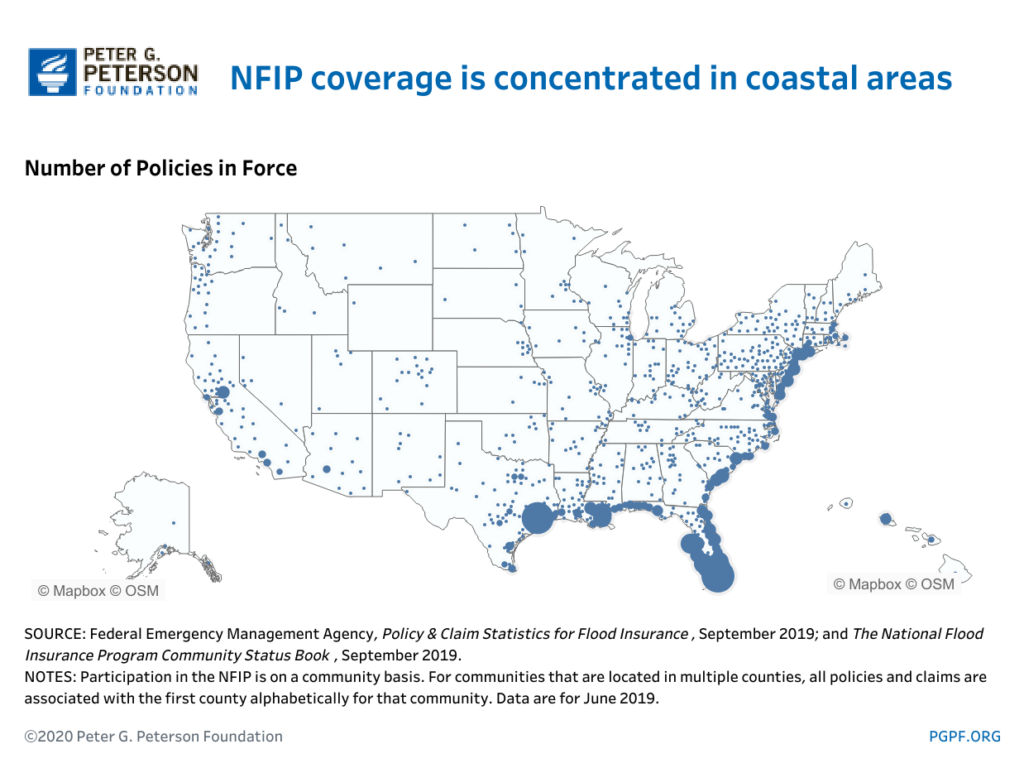
The NFIP map, often called a Flood Insurance Rate Map (FIRM), is crucial for understanding flood risks across the United States. These maps, produced by FEMA, delineate flood hazard zones, indicating areas prone to flooding. Homeowners and businesses rely on NFIP maps to assess their property's vulnerability, influencing everything from insurance premiums to building codes. Knowing your specific flood zone helps in making informed decisions about flood insurance coverage, potentially saving significant financial hardship. This essential tool guides community planning and development, ensuring safer construction in high-risk areas. Understanding the NFIP map empowers citizens to protect their assets.
Ever wondered if your home is truly safe from flooding? In the United States, understanding your flood risk is absolutely critical. That's where the NFIP map comes into play. These maps are powerful tools, guiding homeowners and communities alike to prepare for potential water damage.
This article will empower you with knowledge about NFIP maps. We'll explore their purpose, how they impact you, and why they are essential for informed decision-making. Knowing your flood zone could be the best protection you ever invest in.
What is an NFIP Map? Understanding Your Flood Risk
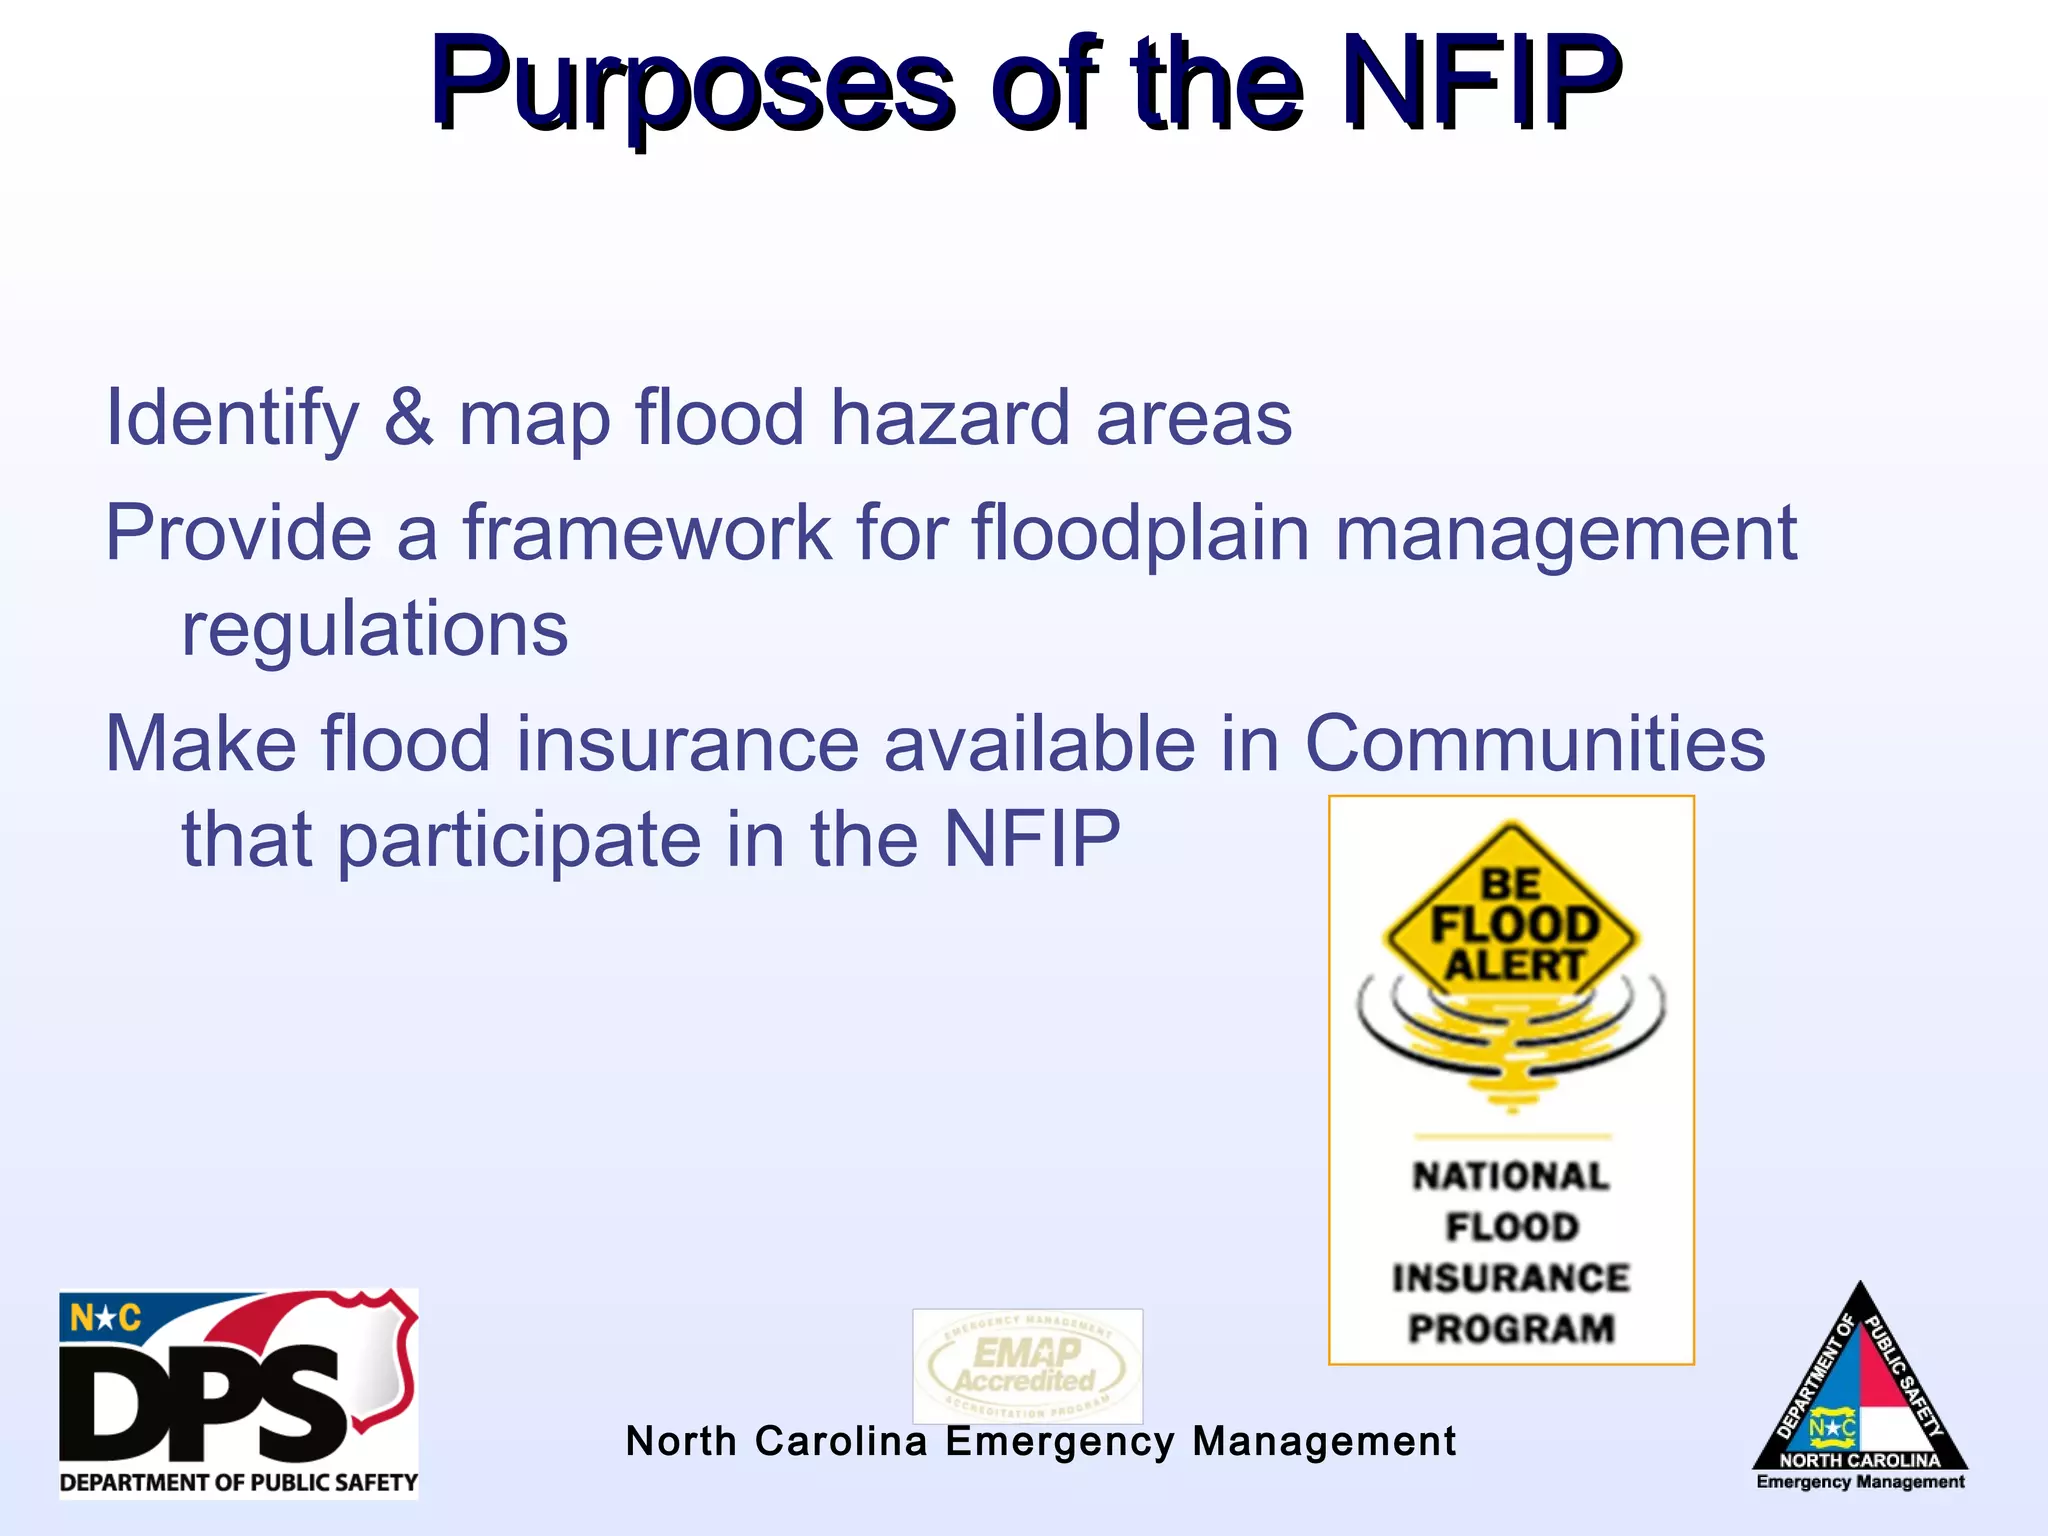
An NFIP map, officially known as a Flood Insurance Rate Map (FIRM), identifies specific flood hazard areas. These maps are created by the Federal Emergency Management Agency (FEMA) for the National Flood Insurance Program (NFIP). They show the probable extent of flooding in different locations, categorizing areas into various flood zones. This vital information helps determine flood insurance requirements and building regulations.
Why Do NFIP Maps Matter for Your Property? Protecting Your Investment
For homeowners and businesses, NFIP maps are incredibly important. Your flood zone designation directly influences whether you are required to purchase flood insurance. Lenders often mandate flood insurance for properties in high-risk zones. Understanding your property's flood risk can also guide decisions on home improvements or protective measures. It's about proactive protection for your valuable assets.
How to Read Your NFIP Map: Decoding the Zones
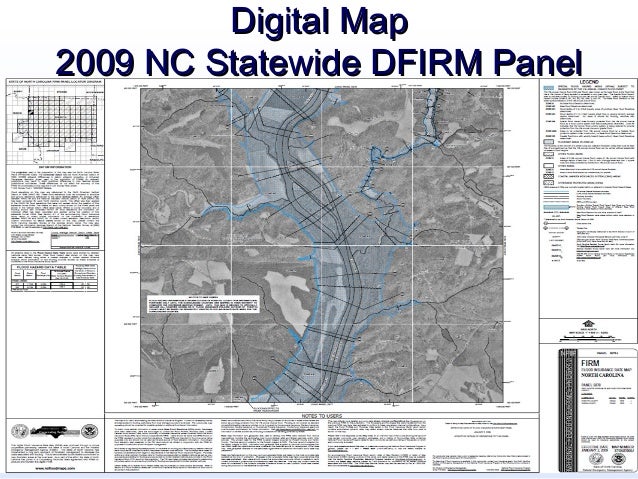
Learning to read an NFIP map helps you understand your specific flood risk. The maps categorize areas into zones like Zone A (high-risk, no base flood elevation determined), Zone AE (high-risk, base flood elevation determined), Zone X (moderate to low risk), and Zone D (undetermined risk). Each zone signifies a different level of flood hazard. Online tools and local officials can help interpret your specific location's map details.
NFIP Map Key Information Table
| Map Name | Flood Insurance Rate Map (FIRM) |
| Creator | Federal Emergency Management Agency (FEMA) |
| Purpose | Identify flood hazard areas, determine insurance needs |
| Key Zones | A, AE, V, X, D |
| Impact | Insurance costs, building codes, property value |
| Access | FEMA Flood Map Service Center, local planning departments |
What Others Are Asking? Common NFIP Map Questions
What is a NFIP map and why is it important?
An NFIP map, or Flood Insurance Rate Map (FIRM), identifies areas with varying flood risks across the United States. It's crucial because it dictates flood insurance requirements for properties, influences building codes, and helps communities and homeowners understand and mitigate potential flood hazards, protecting investments from water damage.
How do I find my flood zone on an NFIP map?
You can find your flood zone by visiting the FEMA Flood Map Service Center online. Enter your address, and the site will display the official NFIP map for your location, indicating your property's specific flood zone designation. Local government planning or engineering departments can also assist you in interpreting these maps.
What are the different flood zones on an NFIP map?
On an NFIP map, common flood zones include Zone A and AE (high-risk areas with a 1% annual chance of flooding), Zone V (high-risk coastal areas), and Zone X (moderate to low-risk areas outside the 100-year floodplain). Each zone specifies different levels of flood hazard and insurance implications.
Is flood insurance required if I am not in a high-risk NFIP map zone?
While not federally mandated for properties outside high-risk NFIP map zones, flood insurance is still highly recommended. Over 25% of flood claims come from moderate-to-low risk areas. Lenders may also require it depending on their specific criteria. It offers financial protection where homeowners insurance does not.
How often are NFIP maps updated and why?
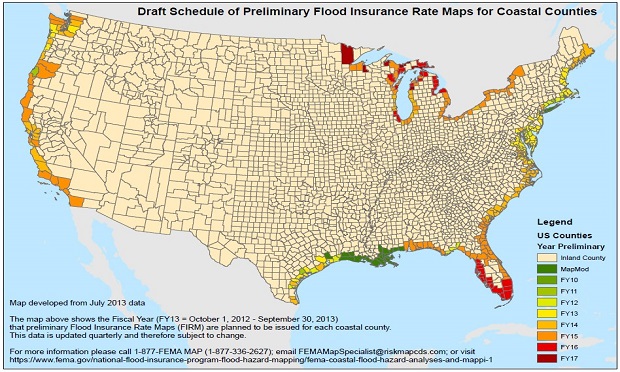
NFIP maps are updated periodically by FEMA, though the frequency varies by community. Updates occur due to new construction, environmental changes, or improved mapping technology. These revisions ensure the maps accurately reflect current flood risks, impacting insurance rates and community planning to better protect properties and lives.
FAQ about NFIP Map
The **NFIP map** is a Flood Insurance Rate Map (FIRM) created by FEMA. It outlines areas with different flood risks, helping assess flood hazards. This map is vital for property owners.
Homeowners, businesses, lenders, insurance agents, and local government officials all use **NFIP maps**. They guide decisions on flood insurance, building regulations, and community planning.
**NFIP maps** are important for identifying flood risk and determining flood insurance requirements. They help individuals and communities prepare for and mitigate the financial impacts of potential flooding, protecting valuable assets.
You can access your local **NFIP map** through the FEMA Flood Map Service Center website. Simply input your address to view the official flood zone information for your property. Local government offices also provide assistance.
Summary of Key Points about NFIP Map
The **NFIP map** is a critical tool for understanding flood risk in the United States. FEMA develops these maps, known as FIRMs, to define flood zones and inform flood insurance requirements. Property owners must check these maps to protect their investments and comply with lending rules. Regular updates ensure the maps remain accurate, guiding safer community development.
Understanding flood risk, FEMA's role, flood insurance requirements, property protection, community planning, flood zone designation, property vulnerability, informed decisions, flood hazard areas.
Floodplain Management Planning Land Management Division Of Nfip Map Will The NFIP S New Flood Risk Model Solve The Insurance Gap 02 NFIP Feature 2 Of 5 FEMA Draft Map 2013 CHAPTER 3 MAPS AND MAP CHANGES Ppt Video Online Download TYPES OF NFIP MAPS
What Is A Wireframe Map And Why Is It Essential For 2026 13616905 6b41 48fd A090 A Private Market Solution To Flood Insurance Reducing Federal Exposure Image 5 NFIP Policies To The Private Market A Path To A More Sfha 768x244 2025 2026 1280px 2025-2026 Iranian Protests Map.svg
National Flood Insurance Program Extension Nfip States Final 2022 Nfip Map Numbers Flutzonen In Lee County Budget Basics The National Flood Insurance Program NFIP Coverage 1024x768 Nfip Flood Maps Holt Flood Insurance Nfip Flood Maps Pc 162
2026 Gemini Generated Image Flood Insurance Trends 2026 Private Market Growth And NFIP Shifts Preparing For Homeowners Insurance Renewals A Guide For Agents 1080x675 PPT National Flood Insurance Program NFIP And Map National Flood Insurance Program Nfip And Map History And Overview Dt Flood Insurance Trends 2026 Private Market Growth And NFIP Shifts New Flood Zone Maps What Insurance Agents Need To Know 1080x675
National Flood Insurance Program The New FEMA Guidelines PPTX National Flood Insurance Program The New FEMA Guidelines 1 320 Introducing The 2026 Senate Interactive Map 270toWin Senate Incumbent Managing The Climate Change Fueled Property Insurance Crisis Center Full Last Frost Date Predicted For 2026 Last Frost Date Map The Almanac Frost Date Map 2026 2
Flood Insurance Trends 2026 Private Market Growth And NFIP Shifts Elevating Coverage ES Insurance For Luxury Homes Featured 980x653 Flood Insurance Trends 2026 Private Market Growth And NFIP Shifts Flood Insurance Trends 2026 980x551 2022 Nfip Map NumbersPPT NFIP Map Revisions And Amendments Key Differences National Flood Insurance Program Revisions And Amendments To Nfip Maps N
The Ultimate Risk Map Of 2026 SAFETURE Riskmap 2026 EN Scaled 2022 Nfip Map Numbers 1056x816 Federal Flood Map Changes Affect Monroe County Property And Insurance Nfip Flood Map Changes 2022 Nfip Map Numbers Flood Zone Map
Flood Insurance Trends 2026 Private Market Growth And NFIP Shifts Surplus Lines Insurance Insuring The Unique And Hard To Place 1080x675 WisdomBos Blog Nfip Overview Flood Risk Information System Elevation Certificate 93 638 NFIP Overview Flood Risk Information System Elevation Certificate PPT NFIP Overview Flood Risk Information System Elevation Certificate 3 2048 2022 Nfip Map Numbers Screen Shot 2020 02 11 At 5.14.53 AM
ASFPM Flood Mapping The Nation Report A Cost Analysis For Completing ASFPM Report Coverpage 1000px